Daily Target Summary
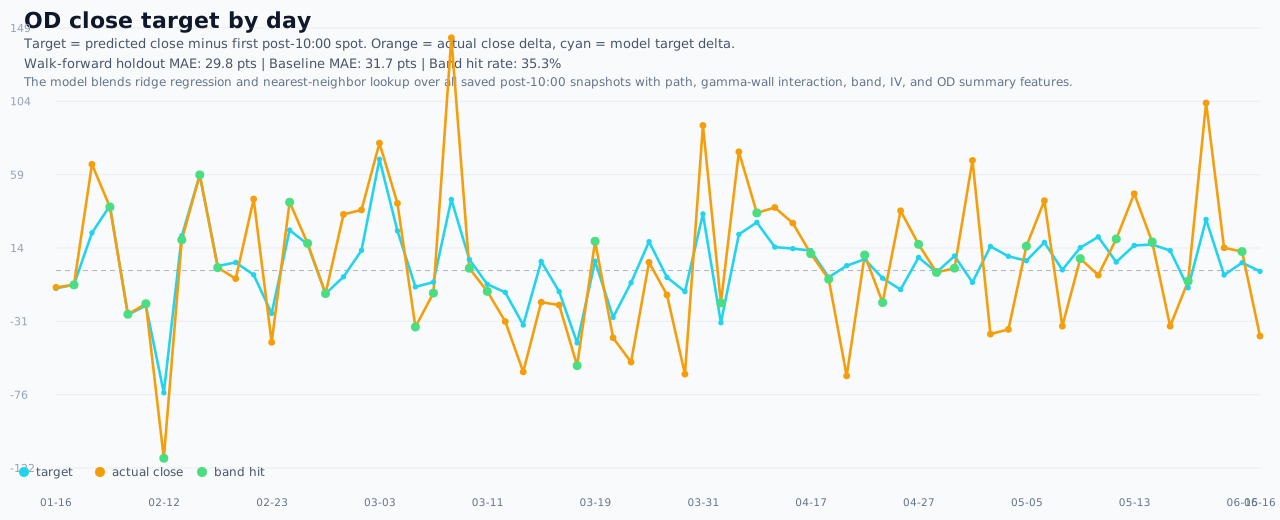
Compact day-by-day target summary. Cyan is the model target, orange is the actual close delta, green markers mean the close landed inside the model band.
Target vs Actual
Cyan is the model target delta. Orange is the actual close delta from the first post-10:00 snapshot on each day.
target
actual close
band hit
Model read
loading…
What this page shows
Every row is the first post-10:00 snapshot of a day. The model uses price path, gamma-wall interactions, the opening band, IV, and OD summary features to estimate a target price directly.
Day-by-day report
Sorted by date. Target band is the middle 50% of the analog neighbors. "Band hit" means the actual close landed inside that band.
| Date | Snapshot | Time | Regime | Spot | Target | Band | Close | Actual Δ | Target Err | Band Hit | Snapshots |
|---|